
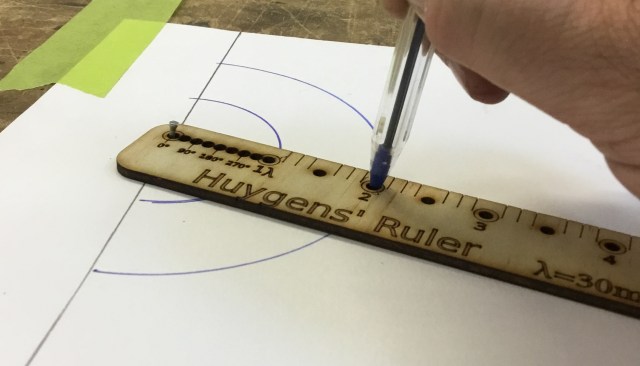
Here’s a quick project to make it easier to draw examples of interference patterns and wave behaviour. I call it Huygens’ Ruler:

It’s based on the idea of Huygens’ principle, the idea that every point on a wavefront becomes the source of spherical wavelets that make up the next wavefront.
Here’s how you use it. Drive a nail or thumbtack through some cardboard, and drop the ruler on top ( I just nailed into the desk of the makerspace, because meh, that table’s already seen a lot worse):
Using the Huygens’ Ruler
There are circled markings for every integer wavelength, and also holes for half-integers. This means you can easily make diagrams with different colours for the ‘peaks’ and ‘troughs’ of a wave, and see by the intersections where they reinforce, and where they cancel out.

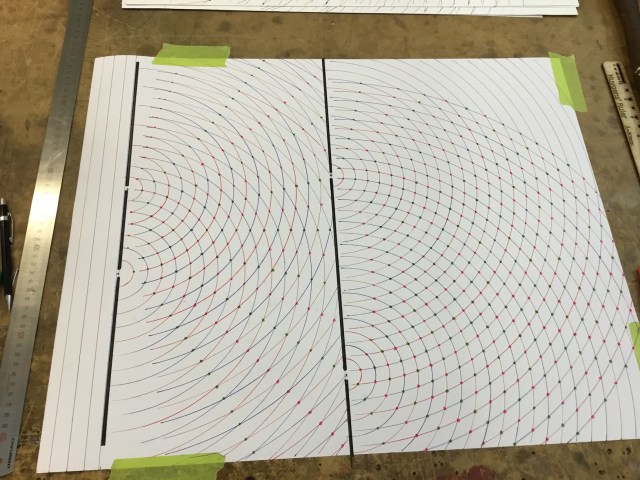
Green dots are where the two waves reinforced each other, and red dots are where the waves cancelled out.
Here’s a few nifty demonstrations that are possible to do with the rulers. First off, we can see how changing the only wavelength of the two sources changes the interference pattern spacing:

Left: 3cm wavelength, Right: 4cm wavelength. Sources are 10cm apart in both
Next, we can see the effect of changing the phase of one of the sources. To do that, instead of putting the nail in the first hole, we use one of the later ones:

Setting the phase of the source at 90 degrees
Here’s the effect that has on the resulting pattern:

Top drawing: No phase difference. Centre nodes head straight to the right. Bottom drawing: 90 degree phase shift between sources, and the resulting beam is ‘steered’ downwards.
This is the basis behind the idea of Beamforming, and also represents the simplest possible example of a phased array.
I added markings to the body of the ruler so that it’s possible to measure what the phase is at any point. This makes it easy when a wave hits a gap in a wall, for example. In that case the wave will be re-emitted starting at that phase again. (e.g. if the ruler hits the wall at the 270 degrees mark, you would then draw the next source with the nail on the 270 degree point.) That way a blue line always represents the same amount of distance from the source, via whatever holes or path you use (modulo the wavelength).
I’m rather happy with this project. I had a few rounds of revisions, but I’m quite pleased with the final result, and it’s pretty fun to draw with.
Soothing. This is my version of those adult colouring books, with the added bonus that it involved using a hammer
Files are here for anyone that wants to make their own:
https://www.thingiverse.com/thing:3248998

Pingback: Tangent Ruler – Draw circles passing through two points | Tinkerings